Posted 24 November 2022

How to measure a quake (part one)

“A 4.5 magnitude earthquake struck 50km south of Renwick and caused moderate shaking”

New Zealanders are used to seeing and hearing earthquake reports – our country experiences around 20,000 earthquakes a year – but what do the terms and numbers actually mean? In the first of this two-part article, we’ll explore what we measure when it comes to earthquakes and explain the terminology and scales used. In the second part we’ll look at how we measure them and introduce the tools of the trade. Let’s start with a quick reminder of what an earthquake is.

Inner workings

Our planet is a lot less steady and unchanging than it seems – the seemingly solid ground we live on is just a thin crust of solid material moving around on a viscous layer (the consistency of gooey caramel) called the mantle.

The Earth’s crust is in pieces called tectonic plates and the edges of these (tectonic plate boundaries) is where most of the action happens. At some plate boundaries, molten rock oozes up and creates new crust, this is called a divergent plate boundary. In other places, a plate may be pushed under, along or up against another plate - convergent and transform plate boundaries. All the worlds tectonic plates are moving all the time and this isn’t always smooth and steady.

Our planet has a solid crust and a molten core with a viscous layer in between (the consistency of gooey caramel) called the mantle. The crust moves around on the mantle in pieces called tectonic plates. The locations where these tectonic plates move over, under or alongside each other are called convergent, divergent or transform tectonic plate boundaries. Source: AF8]

Sometimes friction will cause one tectonic plate to snag and grab against another, locking them together for years at a time. The tension builds up like a loaded spring and when things finally move – BAM! – a whole lot of energy is released at once. That energy releases along a fault and causes ruptures, cracks and movement - an earthquake.

Cause & Effect

Like a bomb going off underground, the energy from an earthquake ripples out in all directions. The size of an earthquake can be described and measured in two ways – the amount of energy released and the shaking caused by that energy release at different places on the surface – cause and effect.

CAUSE = Energy release (Magnitude)

Magnitude is a single fixed value for each earthquake, regardless of where it is felt or measured, making it useful for comparing and studying earthquakes.

EFFECT = Ground movement (Intensity)

Intensity describes the damage caused by ground shaking on buildings and other infrastructure, and the experience of people in a particular location. Intensity is most useful for understanding earthquake impacts.

Magnitude - Energy released at the focus

Magnitude expresses the amount of energy released at the earthquake's focus. The focus is the starting point of all the seismic waves and the point exactly above it on the Earth’s surface is called the epicentre. Magnitude measurements initially used the Richter scale, but these days scientists use the Moment Magnitude scale, because it works better across all regions and different sizes of earthquakes. The scale goes from 1-10 and is logarithmic.

When an earthquake happens, seismic waves travel out from the focus in all directions. The epicentre of an earthquake is the point directly above the focus on the ground. Source: AF8

Putting it into perspective

Each step up in magnitude represents 10x more ground displacement and about 32x more seismic energy released! So a magnitude 3 earthquake is approximately the equivalent energy release as 1800kg of dynamite, whereas a magnitude 8 earthquake would be like 56 million tons!

And by the way, we’ve never had a magnitude 10 earthquake – the largest was 9.5 in Chile in 1960!

Earthquakes release a huge amount of energy – this diagram compares the energy release of some large earthquakes (on the left) with other natural and man-made phenomenon (on the right). Note: this diagram is intended as an illustrative tool only as there is no exact formula for converting magnitude or volcanic force to megatons of TNT. Source: AF8

Intensity - Ground movement at a specific location

The magnitude of an earthquake isn’t necessarily a good indicator of how intense the shaking will be or how that level of shaking will impact us and that's where intensity comes in. Intensity describes the actual ground movement at a specific location and is affected by factors such as the ground conditions, the depth and our distance away as well as the magnitude.

This means that there are many different intensity measurements for any one earthquake and they are often displayed spatially on map. Intensity measurements can be grouped into two types - human experience measurements and by scientific measurements.

Measuring human experience – Modified Mercalli Intensity Scale (MMI):

The MMI Scale is used globally to express intensity and ranges from 1-12. Have you ever felt an earthquake, gone onto the GeoNet website and submitted a ‘Felt Report’? If so, you’ve used the modified Mercalli Intensity scale (MMI) to tell scientists about the intensity of shaking you felt in your location. This data helps them estimate the impacts of the earthquake across the motu. As well as numbers, the MMI scale uses set terminology for the intensity of shaking – if you look at the descriptions below you can see what is meant by the ‘moderate shaking’ described in the headline at the start of this article.

In Aotearoa New Zealand the Modified Mercalli scale is used to describe earthquake intensity in 12 steps with one representing the weakest shaking and 12 being almost total destruction. Source: AF8

Scientific measurements – Peak Ground Velocity (PGV) and Peak Ground Acceleration (PGA):

Intensity can also be measured using instruments that measure ground movement – seismometers and strong motion sensors. These give us Peak Ground velocity (PGV) or Peak Ground acceleration (PGA) at a given point. These objective measurements are useful for building design, infrastructure planning and understanding the way different materials react to seismic waves. More about how these measurements are taken in How to Measure and Earthquake (Part Two).

Comparing human experience and scientific intensity measurements 

Human experience measurements (like the Felt reports) give a real-time indication of how an earthquake feels to those on the ground. However, in a strong earthquake, people are not going to spend time filling in a form on their phone (if phones are even working).

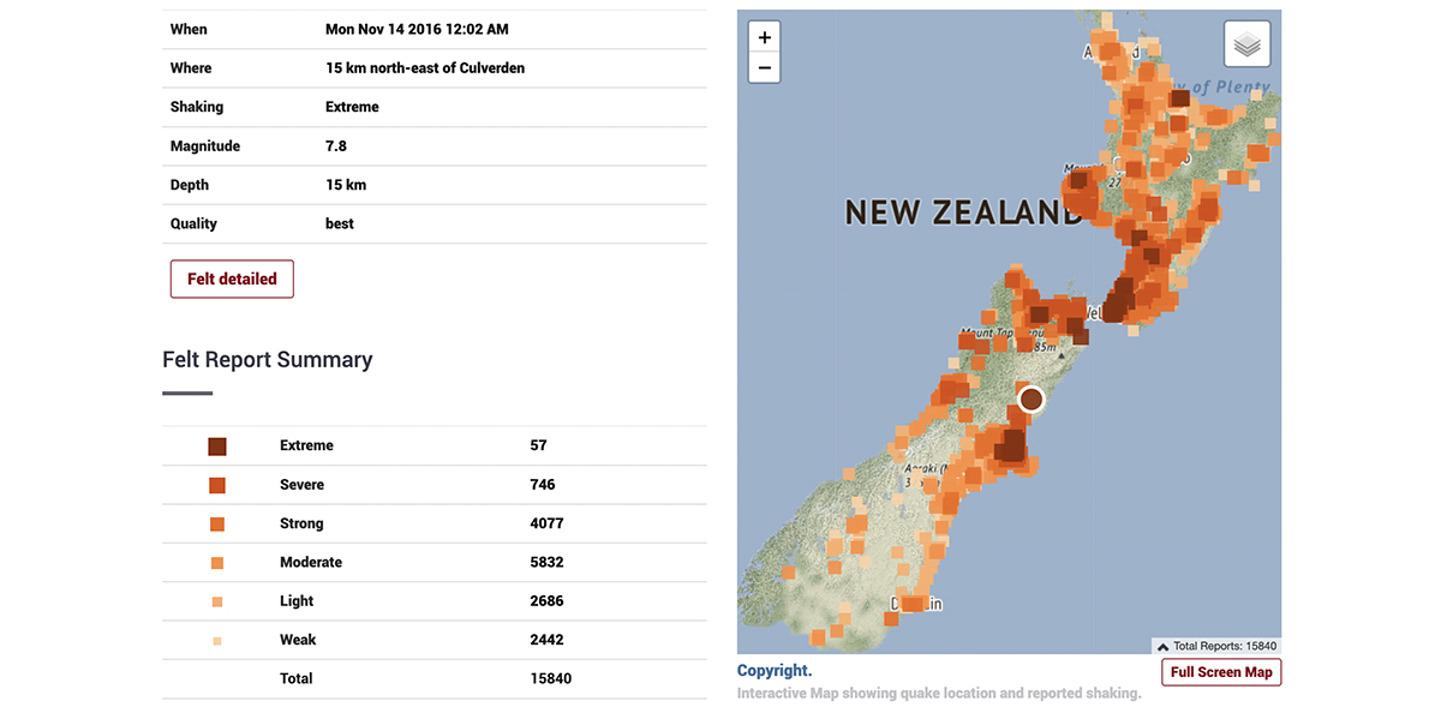
This is evident when you look at the GeoNet ‘Felt report’ (right) for the 2016 Kaikoura Earthquake. You can see a lack of reports from around the epicentre, (where there was the highest intensity shaking happening) as people focused on more important things.

This means that immediately after a big quake, scientists are reliant on the scientific measurements coming in from ground motion sensors to try and work out what is happening to people and structures on the ground. 

A screenshot of the GeoNet ‘Felt report’ that captures the earthquake intensities recorded by members of the public for the 2016 Kaikoura Earthquake. You can see a lack of reports from around the epicentre, (where there was the highest intensity shaking happening) as people focused on more important things. Source: GeoNet]

Is there a formula for converting ground motion measurements (PGV and PGA) into human experience measurements (MMI)?

Not yet. 

Globally, many studies have compared data from ground motion sensors and their countries version of the ‘felt reports’ for sets of earthquakes, hoping to find just such a formula. In January 2021 scientists published the latest ground motion to intensity conversion equations for New Zealand.

The graphs right compare their findings with those of previous studies – you can see that there are obvious trends and the results are similar but not identical. Our collective knowledge of the relationship between magnitude, ground motion and intensity is improving all the time, so hopefully one day such an equation will exist.

Comparison of the relationship between ground motion and intensity from different studies (Peak Ground Velocity PGV on the left, Peak Ground Acceleration PGA on the right). Source: Moratalla et al 2021

Continue the learning

So now you understand the details of that news headline about the latest earthquake – where the focus was, how deep, how much energy was released and how intense the shaking was. Tell all your friends! 


This article is a part of series developed in collaboration with Bounce Insurance, aimed at explaining earthquake science and increasing understanding of earthquake risk and resilience. With thanks to our science partners for their contributions: QuakeCoRE: New Zealand Centre for Earthquake ResilienceResilience to Nature’s Challenges, University of Otago and GNS Science.

Author: Jenny Chandler, AF8 Research Assistant.

Start typing and press Enter to search