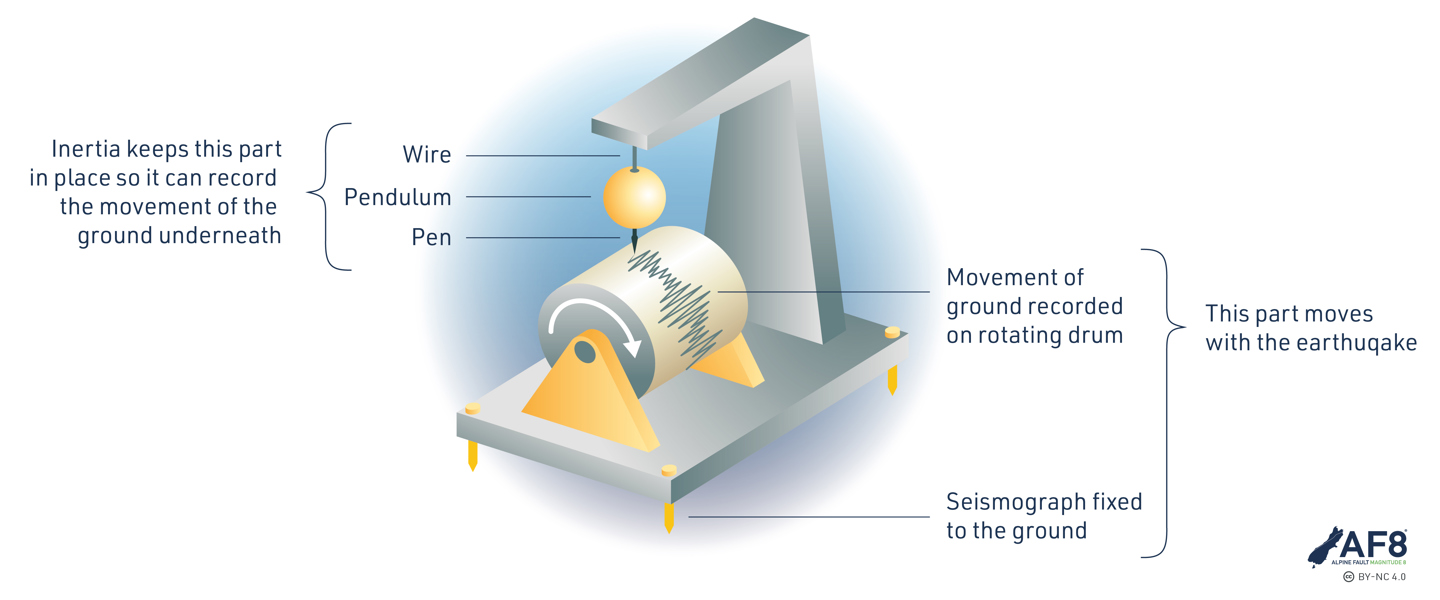
A simple seismograph captures the movement of the earth by allowing some parts to move with the shaking earth while others stay ‘still’. Source: AF8]
This is the second installment of a two-part article on how to measure earthquakes. In part one we looked at the what of earthquakes measurement, now let's look at the how. Earthquakes are not a new phenomenon and people have been trying to understand and measure them for a long time. The first earthquake detector was built way back in 132AD by a Chinese mathematician. It successfully alerted rulers to the presence and direction of a distant earthquake days before foot messengers arrived with the news – a remarkable achievement.
Imagine if that mathematician could see how things have progressed in the last 2000 years – today we know the exact location and magnitude of an earthquake anywhere in the world within minutes! Not only that, but it is possible to warn people that the ground is about to start shaking, and even our mobile phones are helping scientists understand earthquake locations and intensity.
That first Chinese device, brilliant though it was, could only give a vague direction for a distant earthquake – it didn’t capture much detailed information. In the 1700s, scientists developed a way to capture the shaking of an earthquake so they could compare and study it later. The first seismometers and seismographs appeared and, for the first time ever, scientists could capture an objective picture of the Earth’s movement.
The first seismometers consisted of a large stationary pendulum, with a stylus on the bottom. As the earth started to move, the heavy mass of the pendulum had the inertia to stay still within the frame while the stylus scratched a pattern corresponding with the Earth's movement. The depiction of the earth’s shaking – the seismograph – would be scratched into smoked glass (glass with carbon soot) or drawn with pen or pencil on paper.
A simple seismograph captures the movement of the earth by allowing some parts to move with the shaking earth while others stay ‘still’. Source: AF8]
Nowadays, almost all seismometers are digital, but they still perform the same task of capturing the movement of our Earth. Over hundreds of years, as technology and science advanced, so have seismometers and seismographs. They became more and more sensitive and incorporated new technology as it appeared – a pen stylus on paper changed to a light beam on photographic paper and then onto electromagnetic circuitry and even high-resolution GPS data!
Seismometers work well for small motions from distant earthquakes, where there is only a few millimetres of movement, but they don’t work so well for recording strong motion where several metres of displacement can happen – you would need a very large seismograph!
To solve this problem, new instruments were developed that measured velocity over time and acceleration (change in velocity) over time. These are called accelerometers or strong motion sensors and allow even very large movements to be recorded.
Believe it or not, you are probably carrying an accelerometer right now – it’s what smartphones use to tell which way is up! There are some exciting projects that are capitalising on this widespread coverage. You can read more HERE.
What's even better than an accelerometer? Lots and lots of them! One seismometer or accelerometer on its own doesn’t really tell scientists that much about an earthquake, but when they put together the information from a whole network, they can build a really good picture of the size, location and intensity of an earthquake. Even without counting all the smartphone accelerometers in pockets across New Zealand, there is a huge network of instruments that provide constant feedback on every scale of earth motion. These seismometers and accelerometers are maintained and calibrated by GNS Science and chances are there is something near you – take a look.
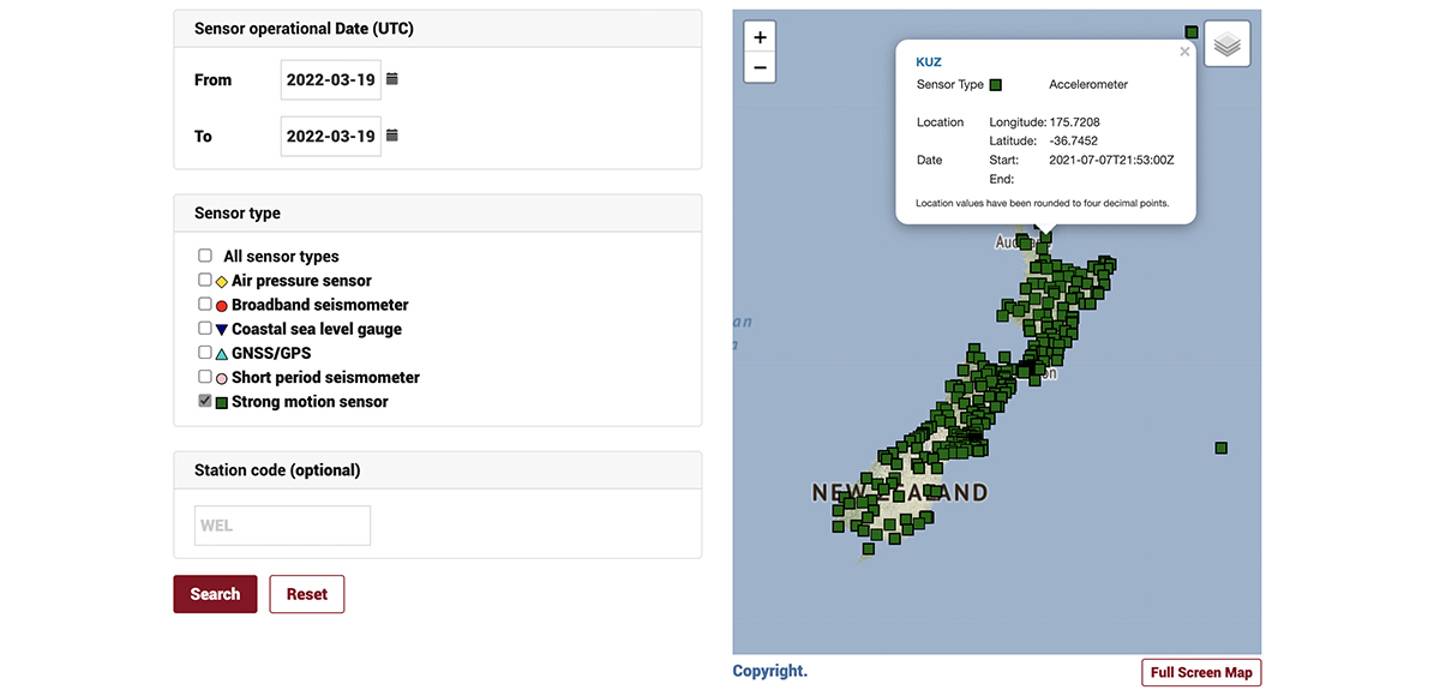
GeoNet collects a range of data from hundreds of strong motion sensors and seismometers arrayed around New Zealand. Source: GeoNet
The ability of this network (and others like it around the world) to capture and share ground motion information related to one earthquake at a lot of different locations is powerful in allowing scientists to understand ground movement over time and space. New Zealand is also part of the Global Seismic Network, a project that links sensors across the whole world.
With all those instruments arrayed across the motu and the world, there is a lot of information coming in all the time, in fact you can see some of it live here. It’s up to scientists to translate all that seismic energy data into the measurements we learnt about in part one – magnitude, epicentre, depth and intensity. And to understand how they do that, we need to take a look at what that data is.
The motion data that a seismometer captures is energy travelling out from the focus (starting point) of an earthquake in seismic waves. There are several different types of seismic waves, each with different properties, and those differences help scientists analyse the data.
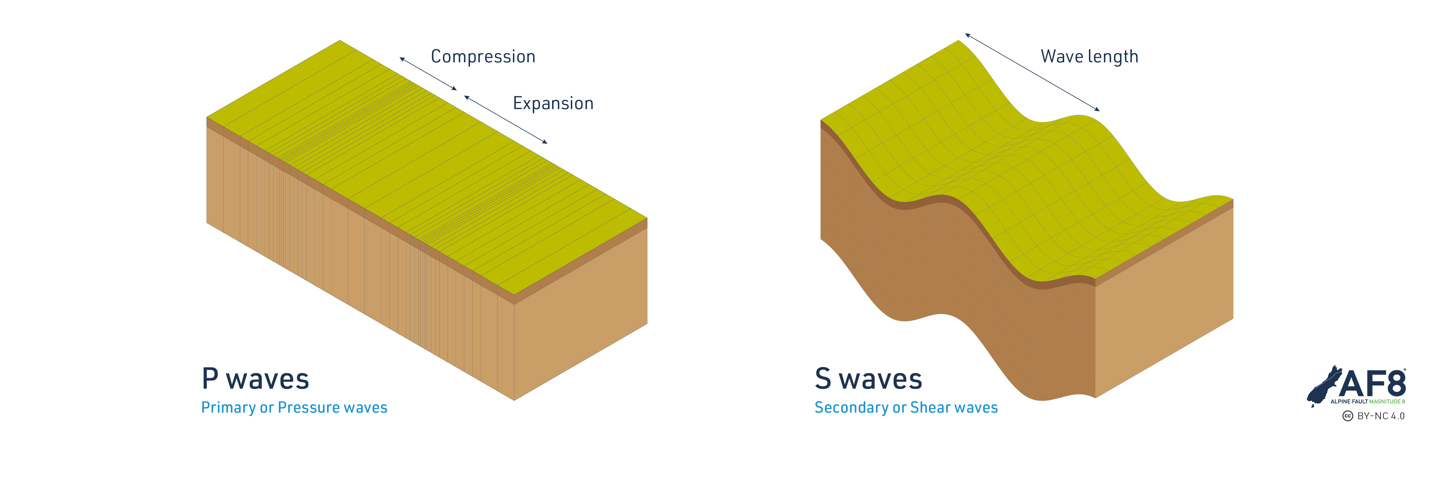
Earthquake energy travels out from the focus in a series of different wave types, each of which move the ground in different ways and travel at different speeds. The P waves are a compression wave and travel the fastest while the S waves are a transverse wave and slightly slower. Source: AF8
P-WAVE - Primary or Pressure waves
These travel through the earth and are the fastest of all the waves, so will arrive first at a seismometer. They travel in a compression (push) style and are often heard rather than felt.
S-WAVE - Secondary or Shear waves
As the name would suggest, these are the second to arrive, they also travel through the earth but move in a transverse motion. They cannot travel through air or water but are often more destructive than P-waves because of their larger amplitudes.
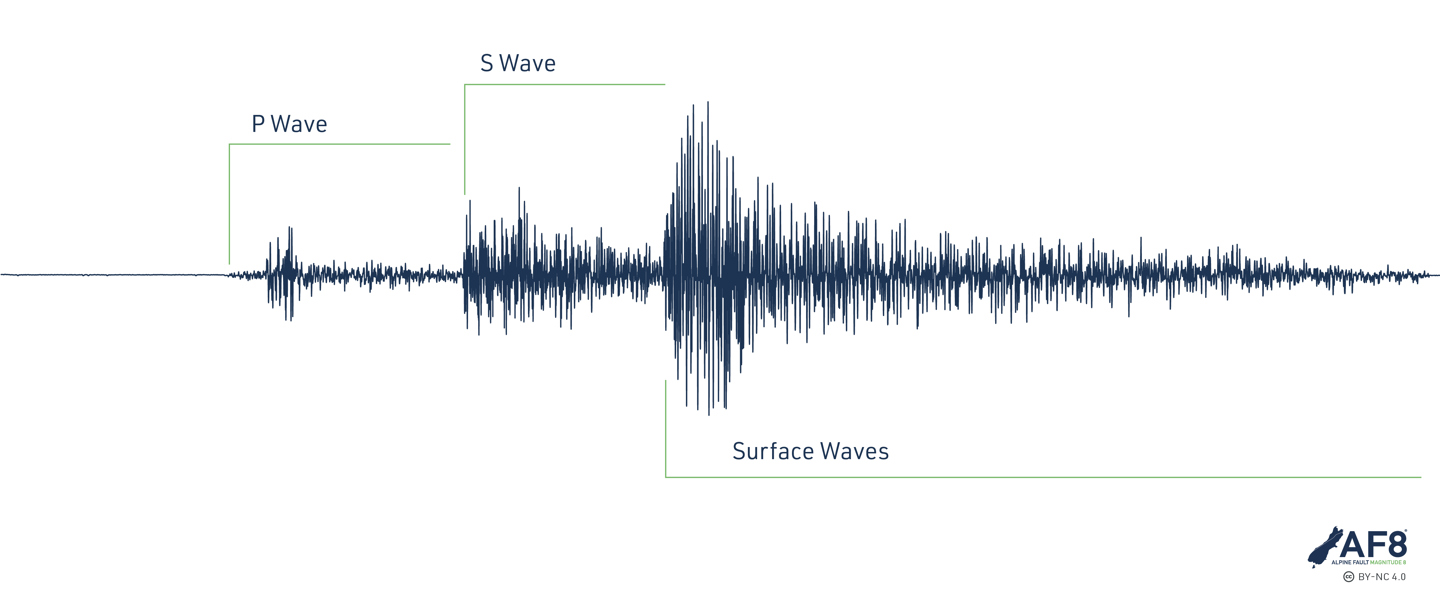
Earthquake energy travels out from the focus in a series of different wave types, each of which move the ground in different ways and travel at different speeds. This seismograph shows the sequence of P waves, then S waves then finally a variety of surface waves. Source: AF8
Even slower than the P and S waves (which are also known as body waves) are the surface waves. Surface waves are generated in very shallow earthquakes and travel along the surface of the earth, so they can be the most destructive to us surface-dwellers. There are several different types of surface waves but the most common are called Rayleigh and Love waves. You can read more about them here.
Different wave types travel at different speeds so they will arrive at a seismometer at different times. As all the different wave types ripple out through the earth, they are picked up by the network of sensors. Because each type of wave travels differently, scientists can use the difference in arrival times at a particular point to estimate how far away the earthquake is. By comparing the graphs from seismometers in several different locations, scientists can build up a picture of the earthquake as a whole. In the video below, Seismologist Dr. John Ristau, GNS Science shows you how it’s done.
Earthquakes are not new, but the technology and understanding we have now would surely astonish our forebears. It has increased in leaps and bounds over the last hundred years so who can guess what the next 100 will bring? There are exciting possibilities ahead in advancing the knowledge we have and applying new technology and people power to increase and share that knowledge.
This article is a part of series developed in collaboration with Bounce Insurance, aimed at explaining earthquake science and increasing understanding of earthquake risk and resilience. With thanks to our science partners for their contributions: QuakeCoRE: New Zealand Centre for Earthquake Resilience, Resilience to Nature’s Challenges, University of Otago and GNS Science.
Author: Jenny Chandler, AF8 Research Assistant.

The safety of Aotearoa New Zealand’s hydro scheme dams in the face of a large Alpine Fault earthquake is a recurring concern raised at many AF8 Roadshow events. We talked to a chief engineer at Meridian Energy about dam safety.

Magnificent mountains with precipitous snowy peaks may be what Te Tai Poutini, the West Coast of Te Waipounamu, the South Island of Aotearoa, is most famous for. But the flatter land at the foot of the mountains is what’s most valuable to residents, farmers, and travellers of the West Coast. A paper by Kiwi earth scientists highlights the landscape changes expected for this precious, habitable land after large earthquakes.
We are seeking expressions of interest for the newly vacant Science Lead position. The AF8 Programme is seeking a suitably qualified scientist with active Alpine Fault hazard and risk-related research, and strong networks and connections across the science and emergency management sectors.