Posted 24 January 2023

Are we having more earthquakes than usual?

Sometimes it feels like there is a big catastrophic earthquake somewhere in the world every few months – Japan, Italy, Indonesia, Haiti, New Zealand, Greece, Nepal – was it always like this, or are we having more big earthquakes than usual? The short answer is (spoiler alert) no. Research shows that while there are periods of heightened activity, the overall occurrence rates are stable. But let’s take a look at why it might seem like earthquakes are on the rise. 

Recording the shakes 

We currently have the best and largest earthquake monitoring system the world has ever known. The Global Seismographic Network is an array of 152 seismometers, linked and managed by the US Geological Survey (USGS). They maintain an interactive map as part of this project which shows the location of most magnitude 4.5+ earthquakes around the world!

The Global Seismographic Network provides near-uniform, worldwide monitoring of the Earth, with over 150 modern seismic stations distributed globally. Data is managed by the US Geological Society and affiliate organisations. Source: US Geological Survey/IRIS

As well as this global network, most countries in seismically active areas operate a national network which also feeds into international databases. The New Zealand Seismometer Network has over 50 main station seismometers which feed live information (available to you at GeoNet) as well as over 250 strong motions sensors that record and share localised information. You can explore a live map for New Zealand here. 

All these sensors, systems and shared networks add up to a lot of data available at our fingertips. For example, when a pair of magnitude 7.5 and magnitude 8.1 earthquakes struck the remote South Sandwich Islands in August 2021, located 1500km east of the Falkland Islands in the southern Atlantic Ocean, it was possible to broadcast the news around the world within minutes. How remarkable that only just over a century since the widespread use of the seismometer, modern telecommunications now mean we know about earthquakes happening anywhere on the planet. 

This means we are not necessarily experiencing more earthquakes than before, but that new technologies enable us to record more earthquakes than even 50 years ago, and the power of the internet means we all know about them more quickly as well.

What is normal anyway? 

Humans are very good at looking for patterns, but with earth processes (like how often earthquakes occur), the challenge is that they happen way beyond human timescales. The Earth is around 4.5 billion years old – that’s very, very old and very hard to comprehend. Have you heard the analogy of the life of the earth compressed into one year? In that case, all of human existence would take place in the last half hour of December 31st (party!). 

It is very hard to comprehend the immense age of the earth. One way of expressing it is as a calendar year, in which case humans arrive on the scene in the last few minutes of New Year’s Eve. Source: AF8

In this analogy, 1 second equals about 145 years, so all the seismographic information we have (from the last 100 years) would take place in the last 0.6 seconds of the year. Paleoseismic evidence (from rocks and landforms) gives another few thousand years of information in some places, but it doesn’t even take us back to 11:59pm on New Year's Eve. So, while it’s impossible to know what is ‘normal’ for the Earth’s whole history, scientists can analyse the data they have to see what is ‘normal’ for now and use modelling to predict what anomalies could still be within the bounds of ‘normality’. 

In 2012 a team of Californian scientists (geologists and statisticians) did just this (their published paper is available here). They wanted to be sure that the higher-than-usual numbers of big earthquakes observed over the preceding years (nine magnitude 8+ earthquakes were recorded between 2004-2011) was within the bounds of ‘normality’. By using a computer to create alternate timelines (100,000 of them!) they were able to conclude that there was an 85% chance of having a cluster of large earthquakes like those observed between 2004-2011. 

So, in some years we do have more earthquakes than others, but that doesn’t mean earthquakes are increasing overall – you can see the variability in the table below from GeoNet based on the 61 years from 1960 to 2021.   

This table shows the variability in the frequency of Earthquakes in New Zealand between 1961 and 2021 (excluding magnitude lower than 4) - some years there are more than average numbers and others lower than average. Source: GeoNet

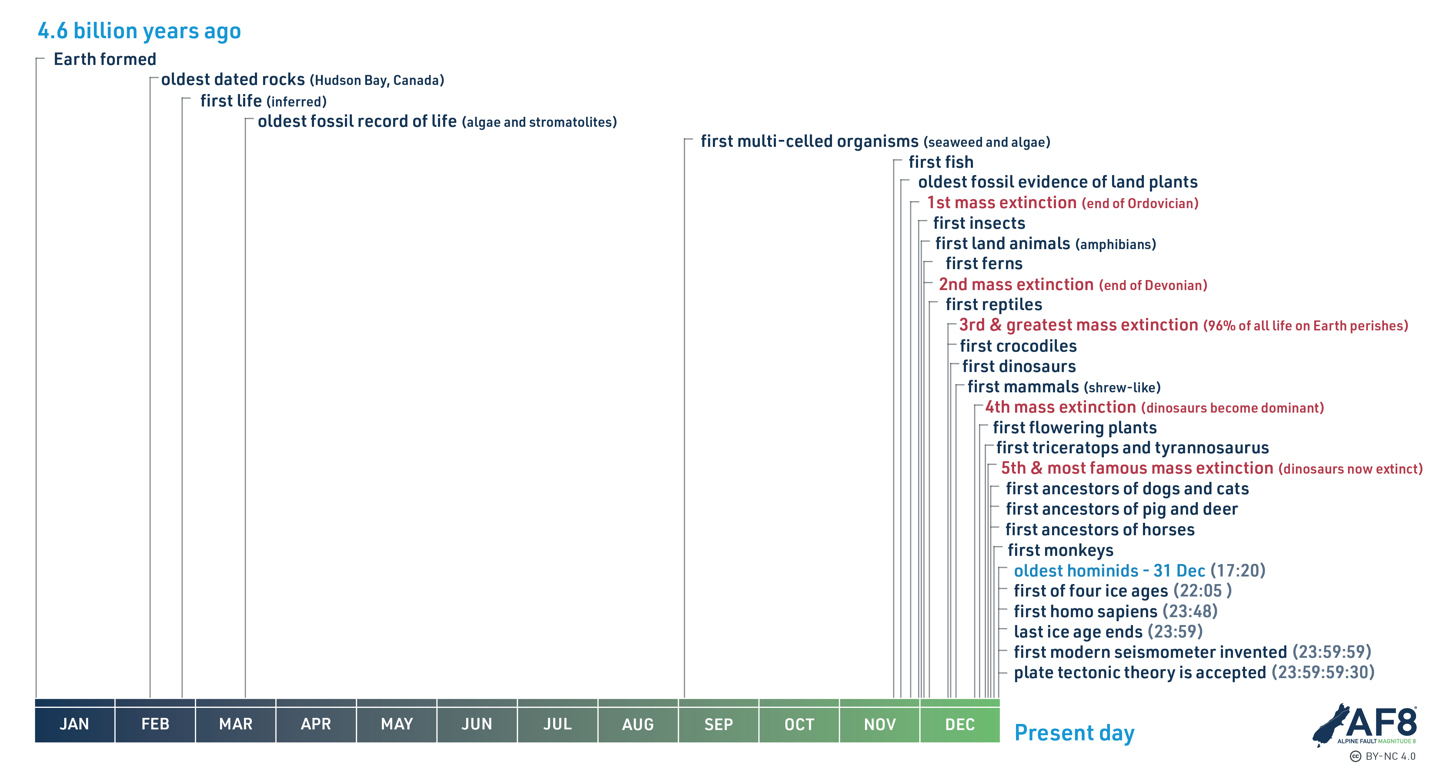
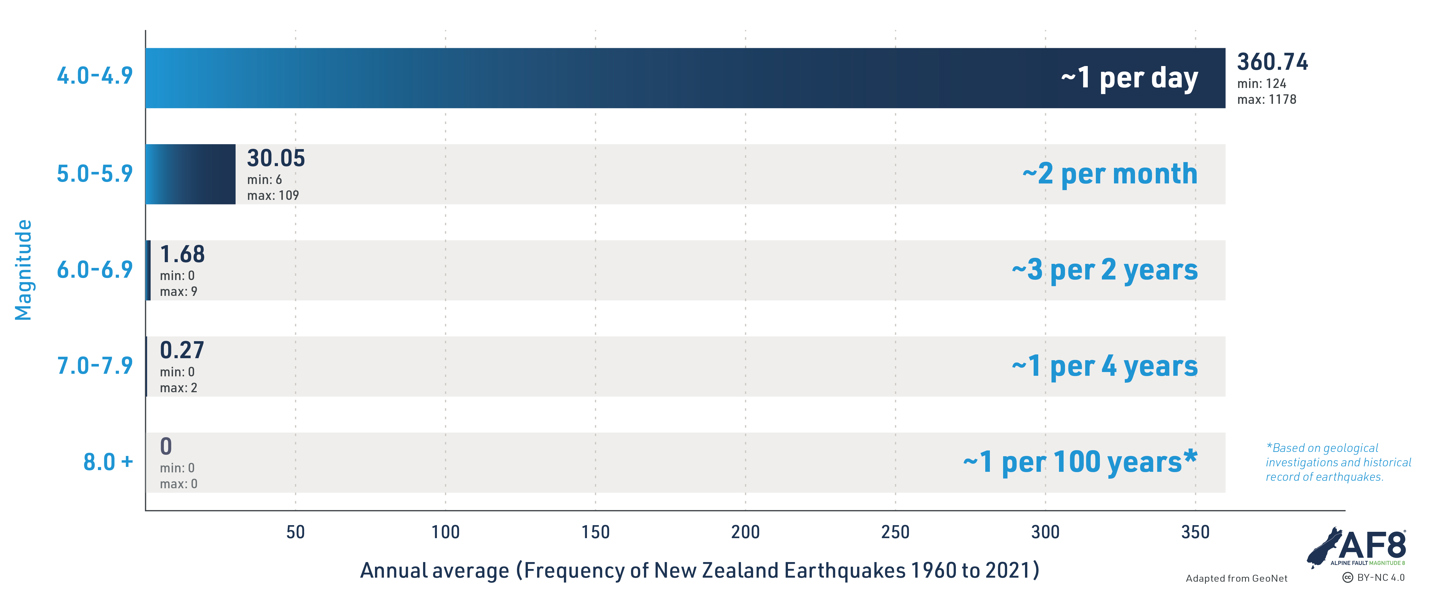
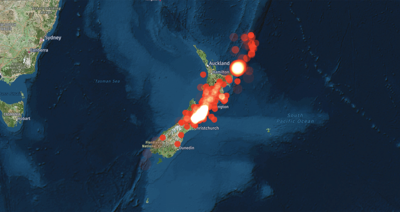
This data tells us that, on average, there are less than two magnitude 6-6.9 earthquakes in New Zealand every year, but one year there were nine! And there is just as much variation on a global scale – check out the global statistics based on the last 100 years here. If there is this much variation over 60 or 100 years, imagine how much there might be over billions of years – variability is normal.

Earthquakes don’t kill people, buildings do 

Earthquakes are a naturally occurring phenomenon, vital to the formation and function of our planet. While the number of earthquakes has not increased, the numbers of disasters caused by earthquakes and the numbers of people affected by earthquakes have been steadily increasing.  

The United Nations Office for Disaster Risk Reduction defines a disaster as: “A serious disruption of the functioning of a community or a society at any scale due to hazardous events interacting with conditions of exposure, vulnerability and capacity, leading to one or more of the following: human, material, economic and environmental losses and impacts.”  

It’s like the old saying about the tree falling in the woods... if an earthquake happens and there is no one there to feel it, does it still cause a disaster? Of course (from a human perspective) the answer is no – disasters occur when natural hazards impact on people and infrastructure.  

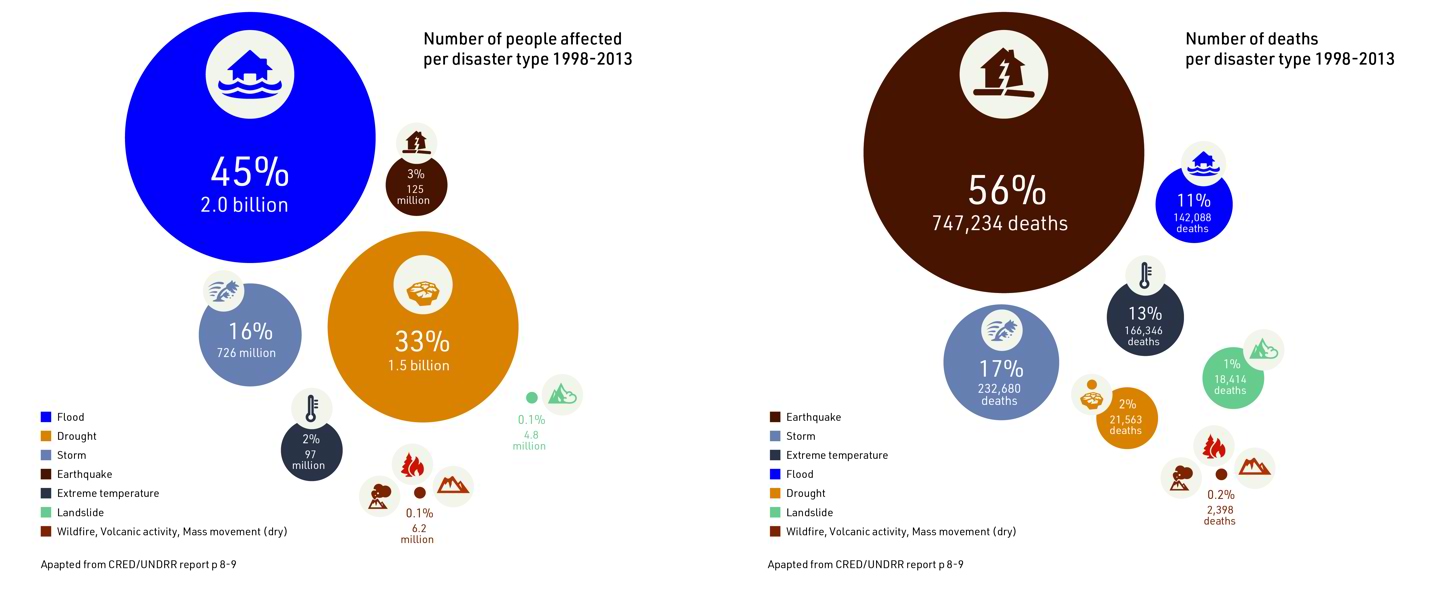
In 2018 the United Nations Office for Disaster Risk Reduction (UNDRR) and the Centre for Research on the Epidemiology of Disasters (CRED) published an in-depth report analysing natural hazard related disasters over the preceding 40 years (you can read it here). It found that, while earthquakes account for less than 8% of disasters globally, they result in 50% of all deaths. Floods are much more common but lead to only 11% of all disaster related deaths.  

An analysis of the global impacts of disasters published in 2018, found that while floods affected many more people globally, earthquakes caused the most fatalities. Source: CRED/UNDRR

In the 20 years between 1998 and 2017 it is estimated that 750,000 people lost their lives in earthquakes, and another 125 million people were affected – injured, made homeless, displaced or evacuated. Big earthquakes are much more deadly and destructive than other types of natural hazard events. Why is that? In short – buildings. Strong ground shaking can damage buildings and other structures, and this is the most common cause of death and injury during a large earthquake – either being trapped in a building or being hit by falling masonry. In poorer countries the built environment (buildings, roads and bridges) is subject to less rigorous engineering and building codes than our own. This means settlements often consist of low quality, quickly built and fragile structures, particularly in fast-growing poor urban centres.   

Let’s take a couple of case studies...

The UNDRR found that people exposed to natural hazards in the poorest nations were more than seven times more likely to die than equivalent populations in the richest nations and building design is a large part of this.

Looking ahead 

The sad reality is, there doesn’t need to be an increase in earthquakes to see a huge increase in the impacts they have – there are a lot of vulnerable people living in unsafe buildings in high earthquake risk zones. And, with bigger, faster data networks constantly recording the Earth’s movement, when an earthquake-related disaster happens, we hear about it almost immediately. As with the impacts of climate change these poorer, more vulnerable communities are often much more severely impacted by natural hazards, but this is not inevitable. 

If this seems like too big a problem to approach on a global scale, perhaps we can focus on the parallels here at home. Aotearoa New Zealand is extremely active tectonically and when a big quake hits, our most vulnerable communities are likely to be the worst affected. Education, safer buildings, early warning and community preparedness are all things we can engage in to reduce the impacts of an earthquake for ourselves and those most vulnerable around us. 


This article is a part of series developed in collaboration with Bounce Insurance, aimed at explaining earthquake science and increasing understanding of earthquake risk and resilience. With thanks to our science partners for their contributions: QuakeCoRE: New Zealand Centre for Earthquake ResilienceResilience to Nature’s Challenges, University of Otago and GNS Science.

Author: Jenny Chandler, AF8 Research Assistant.

Cover image: Still from 'A decade of earthquakes' animation by Charlie Mitchell

Start typing and press Enter to search